
How to Avoid False Supply and Demand Zone Breakouts on Index Charts
Trading Education ·
- Why Index Charts Produce More False Breakouts Than Individual Stocks
- What a Genuine Zone Break Looks Like vs. a False One
- The Multi-Timeframe Filter
- Volume and Price Action Confirmation at the Zone
- The Role of Context: News, Session Timing, and Market Structure
- Building a Pre-Trade Checklist for Zone Entries
- How Supply and Demand Analysis Fits Into a Daily Index Trading Process
- FAQs
- Build the Habit, Not Just the Knowledge
False breakout supply demand zone setups are one of the most reliable ways to lose money on index charts — not because the methodology is flawed, but because the trap is well-designed. You find a clean zone on SPX or RUT, price pushes into it, you take the trade, and the market immediately reverses. The zone looked right. The setup looked textbook. And you still got stopped out.
This article covers why false breakouts happen so frequently at supply and demand zones on index charts, how to distinguish a genuine break from a fake one before you commit capital, and what filters actually help you stay on the right side of the move.
Why Index Charts Produce More False Breakouts Than Individual Stocks
Index options traders face a problem that stock traders largely don't. SPX, RUT, SPY, and IWM are driven by institutional order flow at a scale that dwarfs most individual names. The zones you draw are competing with large players who actively use those same visible levels to trigger stop runs and accumulate positions at better prices.
When a zone on SPX has been tested multiple times and is clearly visible on a standard chart, it becomes a target. Market makers and institutional desks know retail traders are positioned at those levels. A brief push through the zone — enough to trigger stops and pull in breakout buyers or sellers — followed by a sharp reversal is not a coincidence. It's a mechanism.
Individual stocks see this too, but the liquidity profile is different. Index products have tighter spreads and deeper order books, which makes it easier to engineer a brief false break without leaving a lasting footprint.
None of this means you stop trading supply and demand zones on index charts. It means you stop treating every touch as a clean entry and start filtering for quality.
What a Genuine Zone Break Looks Like vs. a False One
Before you can avoid false breakouts, you need to know what separates them from real ones.
Genuine Zone Breaks
A real break through a supply or demand zone on an index chart typically shows:
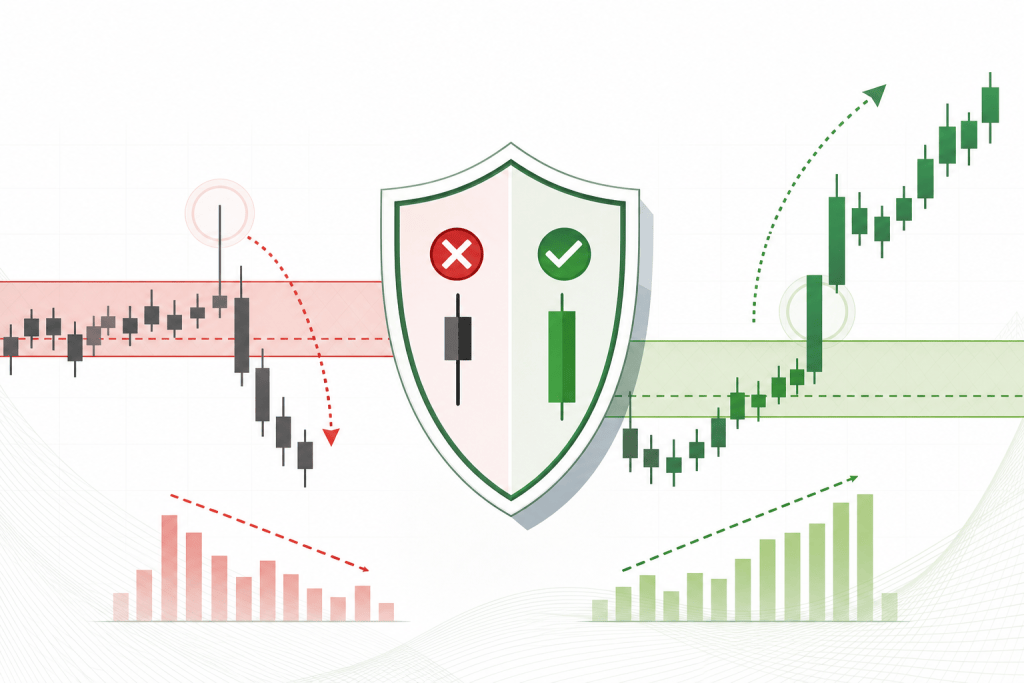
- Strong, impulsive candle bodies closing clearly outside the zone — not just wicks poking through
- Expanding volume on the break candle relative to the prior session average
- Follow-through on the next candle or two — price doesn't immediately snap back inside the zone
- A retest of the broken zone as new support or resistance before continuing in the breakout direction
When all four are present, the probability of a genuine break rises significantly. The retest matters most on index charts because institutional participants often re-enter at the broken zone once it flips polarity.
False Breakout Characteristics
A false break tends to show the opposite:
- Wick-dominated candles that pierce the zone but close back inside it
- Low or declining volume on the break candle — no real conviction behind the move
- Immediate reversal within one or two candles after the breach
- Price returning quickly to the middle or opposite side of the zone
On SPX intraday charts, false breaks at supply zones are especially common in the first 30 minutes of the session, when volatility is elevated and order flow is less directional. They also cluster around economic data releases, where the initial spike is noise rather than a genuine shift in supply and demand balance.
The Multi-Timeframe Filter
One of the most reliable ways to separate false breakouts from real ones is checking whether the zone you're trading aligns across multiple timeframes.
A supply zone visible only on a 5-minute chart carries far less weight than one that also appears on the 30-minute or daily chart. When a zone exists on a higher timeframe, the institutional order flow behind it is more significant. A false break at a higher-timeframe zone is still possible, but the snap-back tends to be faster and more decisive — which actually makes the reversal trade more attractive.
The practical workflow:
- Identify the zone on your primary trading timeframe (for most index options traders, that's the 15-minute or 30-minute chart)
- Step up to the next timeframe and confirm the zone is visible and unbroken there
- Drop to a lower timeframe to time your entry once price approaches the zone
If the higher timeframe shows price has already broken and closed outside the zone on a prior session, the zone you're watching below it may already be invalidated. Trading a stale zone is one of the most common reasons false breakout losses happen — the zone was real at some point, but the market has already repriced past it.
Volume and Price Action Confirmation at the Zone
Volume is one of the clearest filters available on index charts, and most retail traders ignore it entirely in favor of price alone.
When price approaches a supply zone and volume is declining on the push into it, that's exhaustion — not genuine selling pressure. The move lacks the institutional participation needed to break the zone cleanly. In that scenario, the probability of a false break followed by a reversal is elevated.
Flip it around: if price approaches a demand zone on high volume and the candles closing in the zone show long lower wicks with closes in the upper half of the body, that's absorption. Large buyers are stepping in. The zone is holding. A false break downward in this context — a wick below the zone that closes back inside it — is often the highest-probability long entry, not a reason to exit.
Candlestick Signals That Warn of False Breaks
A few specific patterns at zone boundaries are worth watching on index charts:
- Pin bars with wicks extending beyond the zone and closes back inside it are the classic false break signal
- Engulfing candles that close back inside the zone after a brief penetration suggest the break failed
- Inside bars forming just outside a zone indicate indecision and often precede a snap-back
None of these work in isolation. They're most useful when they appear at a zone that aligns across timeframes and shows declining volume on the break attempt.
The Role of Context: News, Session Timing, and Market Structure
Supply and demand zones don't exist in a vacuum. The context surrounding a zone test matters as much as the zone itself.
Economic Data and News Events
On days with scheduled releases — CPI, FOMC statements, jobs reports — the initial price reaction is frequently a false move. The market spikes through a zone, triggers stops on both sides, and then settles into a real directional move that may be the opposite of the initial spike. Trading a zone break in the first five minutes after a major data release is a low-probability decision regardless of how clean the zone looks.
A better approach: wait for the post-news candle to close, assess whether price has genuinely repriced outside the zone or simply spiked and returned, then look for a retest entry if the break was real.
Session Timing on SPX and RUT
The first 30 minutes and the last 30 minutes of the regular session carry elevated volatility and a higher rate of false moves. Zone breaks in those windows deserve extra skepticism. The highest-quality supply and demand reactions on SPX and RUT tend to occur in the mid-session window — roughly 10:30 AM to 2:30 PM Eastern — when order flow is more directional and institutional participation is steadier.
Overall Market Structure
If the daily chart is in a strong uptrend, supply zones on intraday charts are more likely to produce false breaks to the upside before the trend resumes. The zone may slow price temporarily, but the structural bias is against a sustained reversal. Trading against a clear daily trend at an intraday supply zone requires a much higher bar of confirmation than trading with the trend at a demand zone.
Building a Pre-Trade Checklist for Zone Entries
Avoiding false breakouts is easier with a consistent process than with real-time judgment calls. A short checklist helps:
- Does the zone align on at least two timeframes?
- Is volume declining on the approach, suggesting exhaustion?
- Is price forming a candlestick reversal signal at or near the zone boundary?
- Is today a scheduled news day, and if so, has the initial spike settled?
- Does the overall daily structure support a reversal here, or is the trend likely to push through?
If most of these align, the setup is worth considering. If fewer than three do, the probability of a false break is elevated enough to wait for something cleaner.
How Supply and Demand Analysis Fits Into a Daily Index Trading Process
For traders who use supply and demand as their primary methodology on SPX, RUT, SPY, and IWM, false breakouts aren't a reason to abandon the approach. They're a reason to apply it with more discipline.
The traders who get consistent results from supply and demand on index charts aren't the ones taking every zone touch. They're the ones waiting for high-conviction setups where multiple filters align, sizing appropriately for their account, and knowing their invalidation level before they enter.
At Blueville Capital, the daily index options setups are built around exactly this kind of filtered approach — one setup per session rather than a stream of alerts, with the supply and demand reasoning behind each trade made explicit. That context is what separates a useful alert from a ticker dropped in a chat with no explanation.
FAQs
What is a false breakout at a supply or demand zone?
A false breakout occurs when price briefly moves beyond a supply or demand zone boundary but then reverses and closes back inside the zone rather than continuing in the breakout direction. It often triggers stop-loss orders and traps traders who entered on the apparent break.
Why do false breakouts happen more often on index charts like SPX?
Index products attract large institutional order flow, and visible supply and demand zones are known to market participants at all levels. Brief pushes through these zones can be used to trigger retail stop orders and accumulate positions at better prices before the real move occurs.
How can I tell if a zone break is real or false before entering?
Look for strong candle body closes outside the zone, expanding volume on the break candle, and follow-through on the next one or two candles. A genuine break typically retests the zone as new support or resistance before continuing. Wick-only breaks with declining volume are the clearest warning signs of a false move.
Does multi-timeframe analysis help avoid false breakouts?
Yes. A zone that aligns on both your trading timeframe and a higher timeframe carries more weight. If the higher timeframe shows the zone is already broken, the lower-timeframe setup may be stale. Confirming alignment before entering significantly reduces exposure to false breaks.
Should I avoid trading supply and demand zones around news events?
It's generally better to wait for the post-news candle to close before assessing a zone break. The initial spike after major releases like CPI or FOMC statements is frequently a false move that reverses within minutes. Letting the market settle gives you a cleaner read on whether the zone has genuinely broken.
What candlestick patterns signal a false breakout at a zone?
Pin bars with wicks extending beyond the zone and closes back inside it, engulfing candles that return price inside the zone, and inside bars forming just outside the zone boundary are all common false break signals on index charts.
How does session timing affect false breakout rates on SPX and RUT?
The first and last 30 minutes of the regular session carry higher volatility and a greater frequency of false moves. Zone breaks during these windows deserve extra confirmation before entry. The mid-session window generally produces more reliable supply and demand reactions on index charts.
Build the Habit, Not Just the Knowledge
Knowing what a false breakout looks like solves half the problem. The other half is having the discipline to wait for confirmation when a setup is borderline — even after you've been watching a zone for hours and the temptation to enter early is real.
A pre-trade checklist, multi-timeframe alignment, and volume confirmation aren't complicated tools. They're filters that cost you some trades you would have won and save you from many trades you would have lost. Over time, that trade-off is worth making.
To see how supply and demand analysis is applied to daily SPX, RUT, SPY, and IWM setups in practice, visit Blueville Capital to learn more about how the membership and mentoring programs are structured.


