
Supply and Demand Options Trading Explained: The Strategy Behind Blueville Capital
Trading Education ·
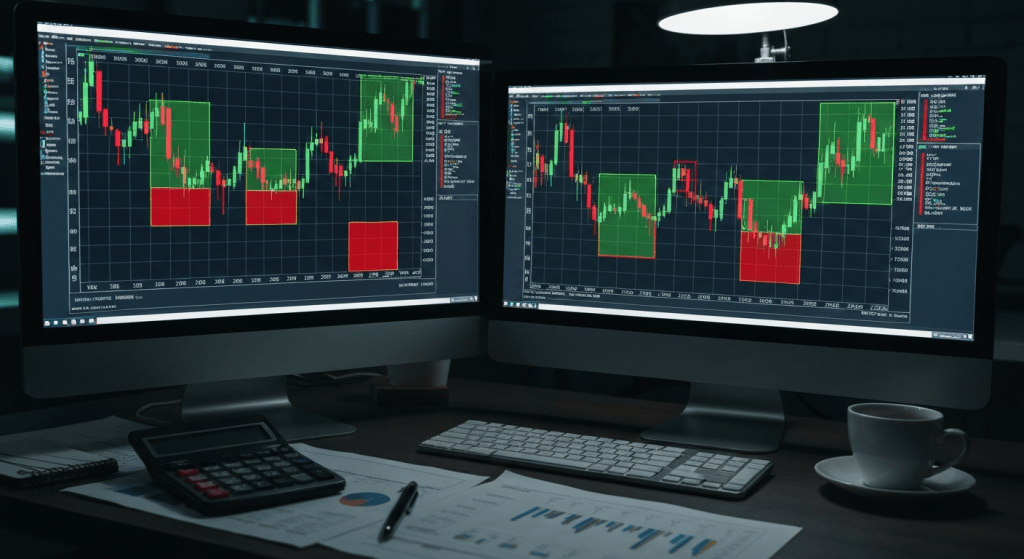
Table of Contents
- What Is Supply and Demand in Options Trading?
- How Supply and Demand Zones Work
- Why Supply and Demand Works for Index Options
- Applying the Strategy to SPX, RUT, SPY, and IWM
- Supply and Demand vs. Other Options Strategies
- Common Mistakes Traders Make with This Approach
- How Blueville Capital Uses Supply and Demand
- FAQs
- Start Trading with a Real Plan
Most retail traders don't lose money because they're not smart enough. They lose because they're reacting to price instead of reading it ahead of time. Supply and demand analysis gives you a structured way to anticipate where the market is likely to move — and when you apply it to options, it becomes a precise tool for finding high-probability entries before the move happens.
This article breaks down how supply and demand options trading works, why it fits index plays on SPX, RUT, SPY, and IWM so well, and how Blueville Capital builds daily trade setups around these principles.
What Is Supply and Demand in Options Trading?
At its core, supply and demand analysis is built on one idea: price moves because of imbalances between buyers and sellers. When buyers outnumber sellers at a given level, demand pushes price higher. When sellers take control, supply pushes it lower.
Those imbalances leave marks on a chart. Supply and demand trading means identifying where those imbalances happened, marking the price zones they created, and anticipating that price will react when it comes back to test them.
For options traders, this creates directional clarity before you ever place a trade. Instead of guessing whether to buy calls or puts, you read where price is likely to reverse or continue — then structure your position around that expectation.
There's no black box here. Every entry has a reason, and that reason is visible on the chart.
How Supply and Demand Zones Work
A zone isn't a single price line. It's a range where a meaningful imbalance between buyers and sellers previously played out — a level where price left in a hurry, suggesting unfilled orders are still resting there.
When price returns to that zone, those orders get filled and price often reacts sharply. That reaction is what you're trading.
Identifying a Supply Zone
A supply zone forms when price drops sharply out of a consolidation area. The consolidation represents a buildup of sell orders. When price breaks lower, sellers were clearly in control. The zone sits at the base of that consolidation — roughly where the selling pressure first kicked in.
When price rallies back into that zone, you have a potential short setup. In options terms, that means buying puts or entering a bearish spread.
Identifying a Demand Zone
A demand zone forms when price launches higher out of a consolidation. Buying pressure was strong enough to move price quickly away from that level. The zone sits at the top of the consolidation, where buyers first stepped in.
When price pulls back into that zone, you have a potential long setup — buying calls or entering a bullish spread.
One rule applies to both: the zone needs to be fresh. A zone that's been tested multiple times has already absorbed most of the resting orders. Once it's been picked apart, it loses its edge.
Why Supply and Demand Works for Index Options
Index options like SPX and SPY are heavily influenced by institutional order flow. Large institutions, market makers, and algorithmic systems all operate around specific price levels — and supply and demand zones often line up with exactly where that activity concentrated.
That alignment is what makes the approach powerful. When you identify a supply or demand zone on SPX, you're not just drawing a line. You're marking a level where significant order flow previously occurred and where that behavior is likely to repeat.
Index options also offer tight bid-ask spreads, deep liquidity, and consistent behavior around key levels — all of which make them well-suited to a zone-based approach. You can define your risk clearly, structure a spread with a known max loss, and target a specific profit level tied to the zone reaction.
Applying the Strategy to SPX, RUT, SPY, and IWM
Each index has its own personality, and supply and demand analysis works across all of them.
SPX is the most liquid and most closely watched. Zones on SPX tend to hold because so many participants are tracking the same levels. Daily plays targeting 50%+ profit are built around high-conviction zones where price is expected to react cleanly.
RUT and IWM track small-cap stocks and typically move with more volatility than SPX. Zones on these instruments can produce sharper reactions — which creates opportunity, but also demands tighter risk management.
SPY is the ETF equivalent of SPX and trades with slightly different options pricing. For traders working with smaller accounts, SPY can be a better fit because the per-contract cost is lower, while the zone-based setups remain just as clean.
The methodology stays consistent across all four. Mark the zones, wait for price to return, confirm the reaction, and size the position appropriately for your account.
Supply and Demand vs. Other Options Strategies
There are plenty of ways to trade options. Here's how supply and demand-based trading stacks up against some common alternatives.
| Approach | Entry Logic | Risk Definition | Directional Bias |
|---|---|---|---|
| Supply and Demand | Zone-based price reaction | Defined via spread structure | Clear, chart-driven |
| Technical indicators (RSI, MACD) | Indicator signals | Varies | Often lagging |
| Earnings plays | Event-driven volatility | Defined, but event-dependent | Neutral or directional |
| Theta strategies (iron condors) | Range-bound assumption | Defined | Neutral |
| Random signal services | Alert-based, no context | Often undefined | Unclear |
The real advantage here is that every entry has a visible reason behind it. You know why you're in the trade, where price is expected to react, and exactly where you're wrong. That kind of clarity is what separates structured trading from guessing.
Common Mistakes Traders Make with This Approach
Even with a solid methodology, traders find ways to undermine their own results. These are the most common ones.
Trading stale zones. A zone that's been tested three or four times isn't fresh anymore. The orders that created it have already been absorbed. Entering a used zone is one of the fastest ways to get stopped out repeatedly.
Ignoring the bigger picture. A demand zone on a 15-minute chart doesn't mean much if the daily chart shows price in a clear downtrend. Always check the higher timeframe before acting on a lower timeframe setup.
Oversizing for the account. Supply and demand gives you a clear entry, but it doesn't eliminate risk. A position that's too large for your account turns a manageable loss into a damaging one. Matching trade size to actual capital isn't optional — it's foundational.
Forcing trades when no clean setup exists. Not every session produces a high-conviction zone. Knowing when to sit out is one of the real disciplines that separates consistent traders from frustrated ones.
Entering before confirmation. A zone is a potential entry area, not an automatic trigger. Waiting for price to show a reaction inside the zone — rather than just touching it — filters out a significant number of false entries.
How Blueville Capital Uses Supply and Demand
At Blueville Capital, supply and demand isn't a marketing phrase. It's the actual methodology behind every daily trade setup.
Each day, the focus is on one high-conviction play across SPX, RUT, SPY, or IWM — built around a supply or demand zone identified on the relevant chart, with a clear entry area, a defined target, and a defined risk level. The goal is targeting 50%+ profit on the position.
What separates this from a generic alert service is that the reasoning comes with the setup. You see the zone, you understand why the trade is structured the way it is, and over time you start building that analytical skill yourself.
For traders who want to go deeper, the Classes and Mentoring program covers supply and demand analysis across four two-hour one-on-one video sessions. You also get unlimited mentor access during market hours — so when a zone is forming in real time, you have someone to work through it with, not a chatbot.
Performance isn't hidden behind screenshots. The Index Trades and Stock Trades logs are publicly viewable, so you can review the actual track record before committing to anything.
Membership tiers are structured around account size — starting at $5K for Base Membership and scaling up to Premium for traders with $200K+ who are active during market hours. That segmentation matters because a $10K account shouldn't be trading the same position sizes as a $150K account, and the daily setups reflect that.
FAQs
What is supply and demand options trading?
It's a methodology where you identify price zones on a chart where significant buying or selling imbalances previously occurred. When price returns to those zones, you enter an options position expecting a reaction — either a reversal or continuation — based on whether you're looking at a demand zone (buying pressure) or a supply zone (selling pressure).
How do I find supply and demand zones for options trading?
Look for areas where price moved sharply away from a consolidation. The consolidation itself — specifically where price paused before the sharp move — marks the zone. Supply zones form before sharp drops; demand zones form before sharp rallies. The zone should be fresh, meaning price hasn't already returned to test it multiple times.
Does supply and demand work for 0DTE options?
Yes. Supply and demand zones apply well to 0DTE options, especially on liquid instruments like SPX and SPY. The key is using intraday charts to identify relevant zones for that session while staying aware of the higher timeframe structure. Because 0DTE options decay quickly, getting the entry right at the zone matters more, not less.
What index options work best with supply and demand analysis?
SPX, SPY, RUT, and IWM are all strong fits. They're liquid, widely traded, and tend to respect institutional price levels. SPX and SPY are the most commonly used for daily setups. RUT and IWM can produce sharper reactions but require tighter risk management given their higher volatility.
How is supply and demand different from support and resistance?
Support and resistance are horizontal lines drawn at obvious highs and lows. Supply and demand zones are areas — not lines — identified based on the imbalance that created the move, not just where price previously bounced. The analysis also accounts for zone freshness and the strength of the move that formed it, which gives you more context for evaluating whether a setup is worth taking.
Can a beginner learn supply and demand options trading?
Yes. The core concepts are straightforward, though applying them consistently takes practice. Starting with one or two instruments like SPX or SPY, focusing on higher timeframe zones first, and working with a mentor who can walk through real setups in real time will shorten the learning curve significantly.
How much capital do I need to trade options using supply and demand?
You can start with as little as $5K if you're using defined-risk strategies like vertical spreads, which cap your maximum loss per trade. Larger accounts have more flexibility with position sizing and can take on setups that require more capital to structure properly. Matching your trade size to your actual account is one of the most important risk management decisions you'll make.
Start Trading with a Real Plan
Supply and demand options trading gives you something most retail traders never have: a specific reason to be in a trade before you enter it. That clarity doesn't guarantee profits — but it does give you a framework for making consistent decisions instead of reactive ones.
If you want to see how this methodology works in practice — with daily setups, transparent performance logs, and one-on-one mentoring available during market hours — visit blueville.capital.


