
Why Supply and Demand Analysis Outperforms Indicators on Short-Expiry Index Options
Trading Education ·
- Why Indicators Struggle on Short-Expiry Contracts
- What Supply and Demand Analysis Actually Measures
- The Structural Advantage for Index Options Specifically
- How to Identify Usable Zones Before the Open
- Where Indicators Still Have a Role
- Applying This to a Real Trading Day
- Why This Matters More as Expiry Approaches
- FAQs
- Where to Go From Here
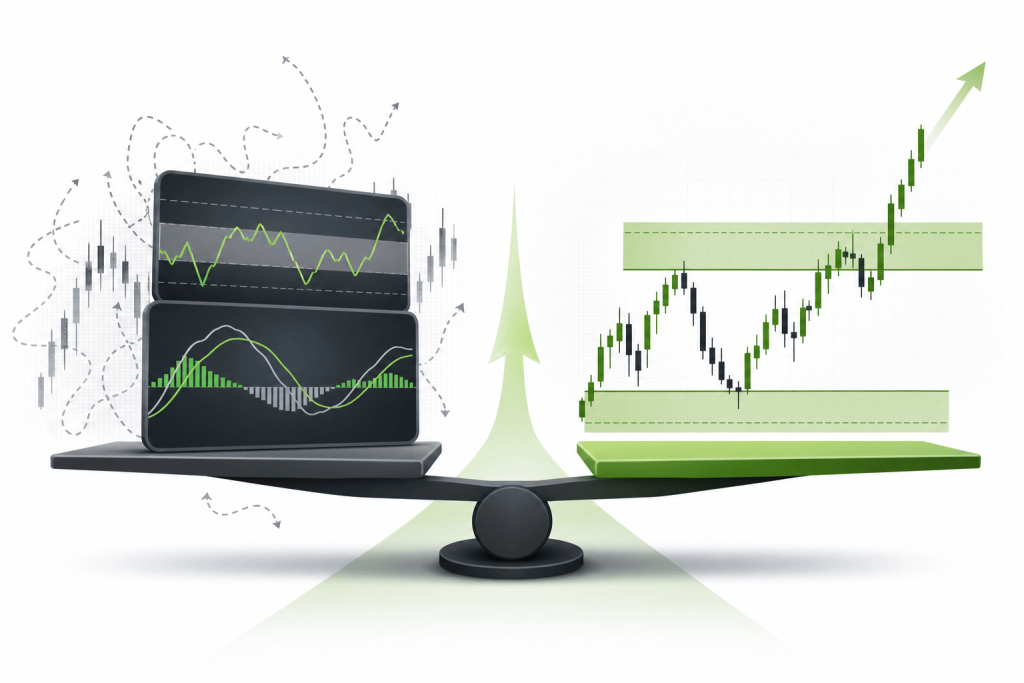
If you trade 0DTE or short-expiry options on SPX, RUT, SPY, or IWM, you've probably watched your indicators betray you at the worst possible moment. The MACD crosses bullish, you enter a call spread, and price reverses hard within minutes. RSI reads oversold, you buy puts, and the market grinds sideways while theta quietly destroys your position. Supply and demand analysis gives options traders a different starting point entirely — one built on where institutional order flow has historically concentrated, not where a formula suggests momentum should be.
Here's why that distinction matters more on short-expiry contracts than anywhere else in the options market, and how to think about applying it in practice.
Why Indicators Struggle on Short-Expiry Contracts
Most popular technical indicators are lagging by design. They're built on smoothed price histories, moving averages, or oscillating calculations that need a meaningful sample of candles before they produce anything useful. On a daily chart, a 14-period RSI has two weeks of price action behind it. On a 5-minute SPX chart during a 0DTE session, that same RSI is working with 70 minutes of data at most — and the first hour may have printed under completely different market conditions.
Theta decay makes this worse. A 0DTE at-the-money SPX option loses value every minute the underlying sits still. An indicator that keeps you waiting 30 extra minutes for confirmation isn't just wrong directionally — it's actively bleeding the trade's value while you hesitate. Short-expiry options punish that hesitation in a way longer-dated contracts simply don't.
Then there's the mean-reversion trap. Oscillators like RSI and Stochastic are designed to flag when something has moved "too far." On a slow equity chart, that logic holds reasonably well. On SPX during a trending 0DTE session, an overbought reading can persist for hours as price walks through supply into a major catalyst. The indicator signals a reversal. The reversal never comes.
What Supply and Demand Analysis Actually Measures
Supply and demand analysis isn't a different type of indicator. It's a different type of question. Instead of asking what price is doing right now, it asks where price previously left evidence of institutional order flow — and whether that evidence is likely to repeat.
A supply zone is a price area where price previously left sharply, suggesting institutional sellers had unfilled orders sitting there. When price returns to that zone, the thesis is that those sellers may still be present, creating resistance. A demand zone works in reverse: a level where price previously launched upward from, pointing to buyers with unfilled orders waiting at that price.
These zones are drawn on higher-timeframe charts — typically daily or 4-hour — and used as reference points on the intraday chart. The critical difference from indicator-based trading is that zones don't shift as new candles print. A supply zone identified on the daily SPX chart at a specific level stays there regardless of what the 5-minute RSI is doing. That stability is exactly what makes it useful for short-expiry options.
Why Zones Hold Up Where Indicators Break Down
When price approaches a well-defined supply zone on SPX, you're watching for a specific reaction: a sharp rejection, a wick, a failed breakout attempt. You're not waiting for a lagging average to cross. You're watching price interact with a level that was drawn before the session opened.
That matters enormously for 0DTE entries because your timing can be much tighter. If you know price is approaching a daily supply zone at 5,620 on SPX, you can position a put spread before the rejection rather than after an indicator confirms it. By the time RSI crosses back below 70, the move may already be 15 points underway and your puts have already repriced significantly.
The same logic applies to demand zones on the downside. A well-tested demand zone gives you a defined level to target for call entries on bounces, with a clear invalidation point just below it. That structure lets you size appropriately and define your risk — two things that get much harder when your entry signal is a lagging oscillator that never tells you where you're wrong.
The Structural Advantage for Index Options Specifically
Index options like SPX and RUT have properties that make supply and demand analysis particularly well-suited to them.
These are the most actively traded options markets in the world. The volume of institutional participation in SPX options means that levels where large players have historically acted are more likely to be respected than they would be on a thinly traded individual stock. The institutional footprint is larger and more consistent.
SPX and RUT also aren't subject to the single-stock event risk that can blow through technical levels without warning. A supply zone on SPX won't be obliterated by an unexpected earnings miss from one company. The index absorbs individual stock noise, which makes price levels stickier and more predictable.
And the cash-settled nature of SPX options means you're trading pure price movement — no complications from early assignment or physical delivery. The price you're analyzing is the same price that determines your profit or loss at expiration. That clean relationship between price and payout makes precise level-based entries more meaningful.
How to Identify Usable Zones Before the Open
The practical workflow for a supply and demand approach to short-expiry index options starts before the market opens, not after.
On the daily chart, mark any zones where SPX or RUT previously showed a strong impulsive move away from a consolidation. The zone is the consolidation itself, not the move. You're identifying where the order flow originated, not where it went.
Then drop to the 4-hour chart and look for zones that align with what you found on the daily. Confluence between timeframes increases the probability that a zone produces a meaningful reaction.
Before the open, note which zones are actually in play for the session — meaning zones that price is currently approaching or that sit within the likely range of the day's move. You don't need a zone at every price level. You need the two or three that are relevant to where price is actually trading.
During the session, watch how price approaches those zones. A fast, impulsive move into a supply zone that immediately stalls is a higher-quality signal than a slow grind into the same level. The character of the approach tells you something about the conviction of the buyers running price into your level.
This pre-market preparation is something indicator-based traders often skip because their signals generate in real time. The supply and demand approach rewards preparation — which is one reason it tends to suit traders who treat this as a structured process rather than a reactive one.
Where Indicators Still Have a Role
This isn't an argument that indicators are useless. They serve a legitimate purpose as confirmation tools once a level has been identified.
If price is sitting at a daily supply zone on SPX and the 5-minute chart shows a bearish engulfing candle with RSI rolling over from 72, that combination is stronger than either signal alone. The zone tells you where to look. The indicator tells you the reaction has begun.
The mistake most retail traders make is reversing this relationship — using indicators to find trades, then hunting for a nearby level to justify the entry. That puts the lagging signal first and the structural evidence second, which is backwards.
Use supply and demand zones to define your trade location. Use indicators, if you use them at all, to time the entry within that location. That sequencing changes the quality of your setups in a meaningful way.
Applying This to a Real Trading Day
Imagine SPX is trading at 5,580 in the pre-market. On your daily chart, you have a supply zone between 5,610 and 5,625 from a consolidation that formed three weeks ago before price dropped 80 points. You also have a demand zone between 5,540 and 5,555 from a base that launched a 60-point rally two weeks prior.
Your plan for the session is straightforward. If price rallies into the 5,610–5,625 zone and shows a rejection on the 5-minute chart, you look at a put spread targeting a move back toward 5,555. If price drops toward 5,540–5,555 and shows a bounce, you look at a call spread targeting a move back toward 5,590.
You're not watching MACD for a cross. You're not waiting for RSI to hit a threshold. You're watching specific price levels identified before the open and reacting to how price behaves when it touches them. That's a fundamentally different process — and one that short-expiry options reward because entry timing is tight enough to matter.
At Blueville Capital, daily index options setups for SPX, RUT, SPY, and IWM are built around exactly this kind of level-based approach, with the reasoning behind each setup made explicit rather than just a strike and expiration dropped into a feed.
Why This Matters More as Expiry Approaches
The closer you get to expiration, the more sensitive your position becomes to precise entry location. A 0DTE at-the-money SPX call spread entered 10 points below a supply zone carries a very different risk profile than the same spread entered at the zone. The first gives price room to run against you before the level becomes relevant. The second gives you immediate confirmation or invalidation.
That precision is only possible when you have a defined level to work from. Indicator-based entries don't give you that. They give you a signal at a moment in time, but they don't tell you where you're wrong or how much room price has before your thesis breaks down. Supply and demand zones do both.
For traders serious about improving their short-expiry index options results, shifting from indicator-first to level-first is usually the most important change they can make. It doesn't require new software or a more complex setup — just a different analytical framework applied consistently before the open.
FAQs
What is supply and demand analysis in options trading?
Supply and demand analysis identifies price zones where institutional order flow has historically concentrated, based on where price previously made strong impulsive moves away from a consolidation. Traders use these zones as entry and exit reference points rather than relying on lagging indicators.
Why do technical indicators underperform on 0DTE options?
Most indicators are built on price averages and need a meaningful sample of candles to produce a reliable signal. On a 0DTE session, available data is limited and theta decay punishes the extra time spent waiting for confirmation. Lagging signals cost premium on short-expiry contracts in a way they don't on longer-dated positions.
How do I draw supply and demand zones on SPX?
On a daily or 4-hour chart, identify areas where price consolidated before making a strong impulsive move. The zone is the consolidation range, not the move itself. Mark the top and bottom of that consolidation as your zone boundaries and watch for price reactions when the index returns to those levels.
Can I use both supply and demand zones and indicators together?
Yes, but sequencing matters. Use zones to identify where to look for a trade, then use indicators as confirmation that a reaction is beginning at that level. Reversing this — using indicators to find trades and zones to justify them — tends to produce lower-quality entries.
Does supply and demand analysis work on RUT and IWM as well as SPX?
Yes. RUT and IWM respond to supply and demand zones in the same structural way as SPX. The zones may be slightly less precise given RUT's lower options volume, but the methodology applies equally. Some traders find RUT zones cleaner because the index moves with less intraday noise than SPX during certain sessions.
What account size do I need to trade SPX options using this approach?
SPX options require meaningful capital — each contract covers a notional value of roughly $500 times the index price. Most retail traders applying this methodology to SPX work with at least $25,000 to $50,000 in their trading account, though the right size depends on your risk parameters and the specific spread structures you use.
How do I learn to apply supply and demand analysis to index options consistently?
The most common path is structured education on the methodology combined with live market application and feedback. Reading about zones is straightforward; applying them in real time under pressure is where most traders need guided repetition. One-on-one mentoring accelerates that process significantly compared to self-directed learning alone.
Where to Go From Here
Supply and demand analysis isn't a shortcut or a magic system. It's a framework that puts structural evidence before lagging signals — and that's a meaningful edge when you're trading contracts that expire the same day.
If you want to see how this methodology is applied to daily SPX, RUT, SPY, and IWM setups with the reasoning made explicit, the trade performance logs and membership details at Blueville Capital give you a concrete starting point for evaluating whether this approach fits how you want to trade.


